| Irish District Energy AssociationSupporting and Promoting District Heating and Cooling in Ireland |


|
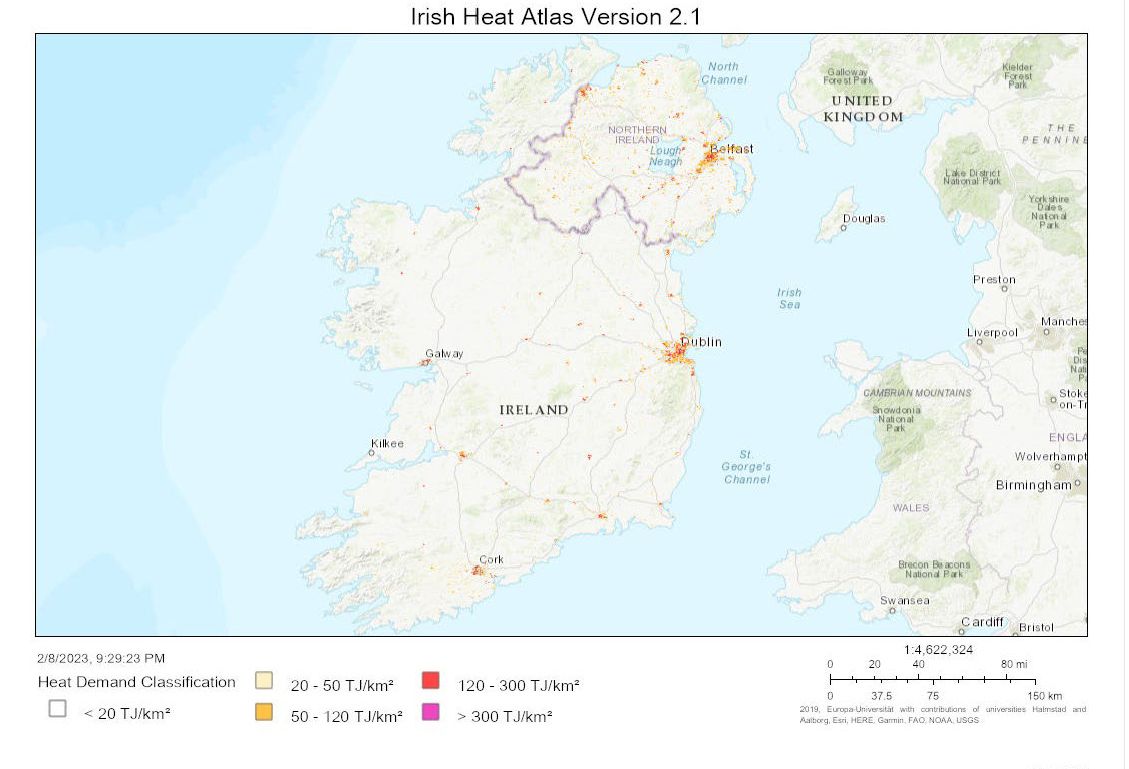
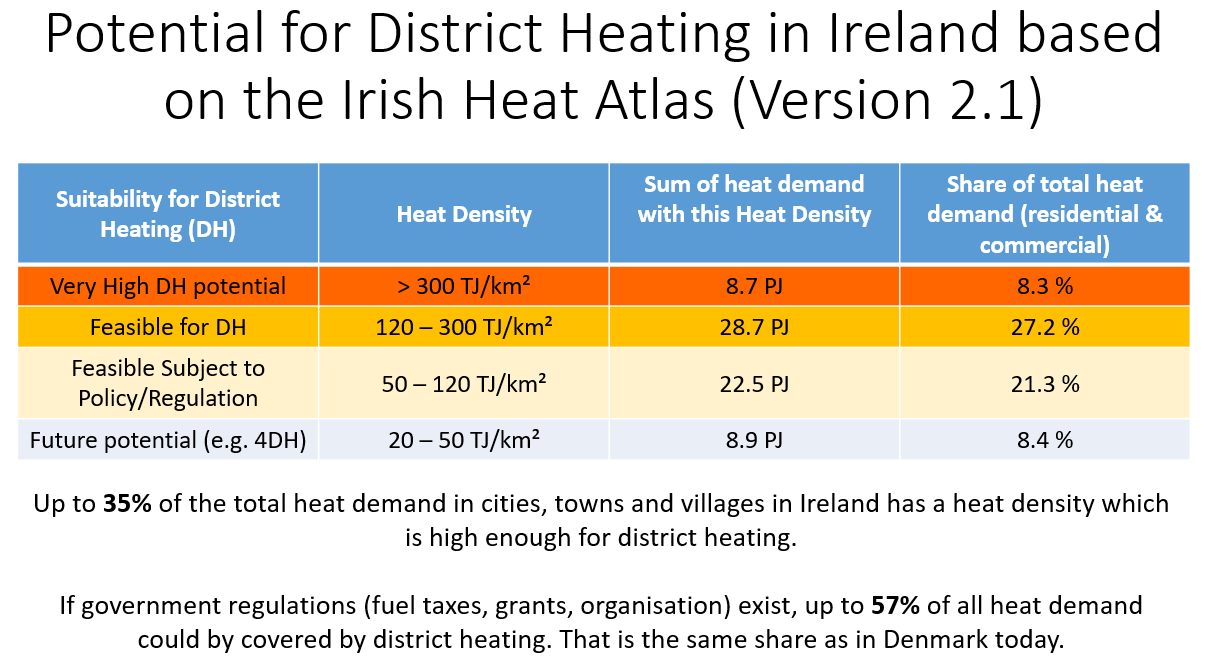
About the Irish Heat Atlas
The development of heat supply strategies can be greatly facilitated by means of geographical and quantitative representations of heat demand and supply. In the Heat Roadmap Europe research initiative, researchers from Aalborg, Halmstad and Flensburg universities have developed heat atlases for European Member States using geographical information systems (GIS) and quantitative mapping. This has led to the development of Peta, the Pan-European Thermal Atlas, which is currently available for 14 EU member states as a deliverable of the Heat Roadmap Europe project under the Horizon 2020 framework. Peta includes heat demands, a zoning of urban and rural areas into prospective heat supply districts, cost-supply relationships for district heating, and an allocation of potential excess heat to prospective district heating systems. There is presently no heat atlas available for Ireland. The objective of this project is to develop a similar heat atlas for Ireland, adapted to local conditions and needs. Based on the modelling framework developed for Peta at the University of Flensburg, a heat atlas shall be designed, which can be used for regional planning and dissemination. The heat atlas will be provided on an ‘All-Island’ basis to include the Republic of Ireland and Northern Ireland, while any ‘totals’ will be provided for each jurisdiction separately e.g. total head demand, total DH potential, etc. The following list of data layers are indicative of what may be provided as part of the Irish Heat Atlas, depending on the data that can be obtained:
|
For further information:
|

| Irish District Energy Association 151 The Island, Chapelizod, Dublin 20, D20 CX27 Company Registration: 619382 |